A higher-education institution using Ellucian Banner SaaS for Student Aid needed a clearer way for Student Aid administrators and finance users to understand application activity and award candidacy. Here, award candidacy refers to whether an applicant had moved into the award candidate stage for a fund.

The operational picture included aid years and periods, students, funds, application states, candidate and award states, and monetary amounts. The goal was to turn those related records into an analytical view that staff could use for day-to-day oversight.
The resulting Student Aid Progress dashboard in Ellucian Insights, Ellucian’s reporting and analytics environment, combines high-level metrics, filters, and student-level detail. Users can move from an overall view of activity to the records behind it.

Give Student Aid administrators and finance users a unified analytical view of application activity and award status that supports operational tracking.
Why Student Aid teams needed a clearer operational view
The institution’s Banner SaaS environment already held the Student Aid operational data behind the process. The reporting challenge was to organize that data around the questions administrative users actually needed to answer.
An application belongs to an aid year and period. A student may apply for a particular fund, progress through an online application, become a candidate for an award, and receive a corresponding status and amount. Those aspects of the process are represented through related Banner data structures rather than a single business-facing view.
The institution therefore needed both summary and detail. Staff needed to see application volume and monetary information by fund, but they also needed to narrow the view to a particular year, period, student, fund, or processing state and inspect the corresponding records.

Turn related Student Aid application and award records into one coherent management view without losing the different business states those records represent.
Building a Student Aid data model for operational reporting
ABCloudz built a custom analytical dataset that brings together the Student Aid information needed from Banner SaaS for the dashboard.
At the application level, the model captures the aid year and period, application completion state, locking information, and related comments. Candidate and award data adds the applicable fund, award status, outcome information, and amount. Person and reference data then provide the student identifiers, names, and business-readable descriptions needed for reporting.
This modeling layer is important because the dashboard is not simply a visualization of one source table. Relationships between Student Aid records have to be preserved, internal values have to be interpreted consistently, and the resulting fields have to support both detailed filtering and higher-level aggregation.

A useful operational dashboard depends on the state model behind it, not only on the visualization layer.
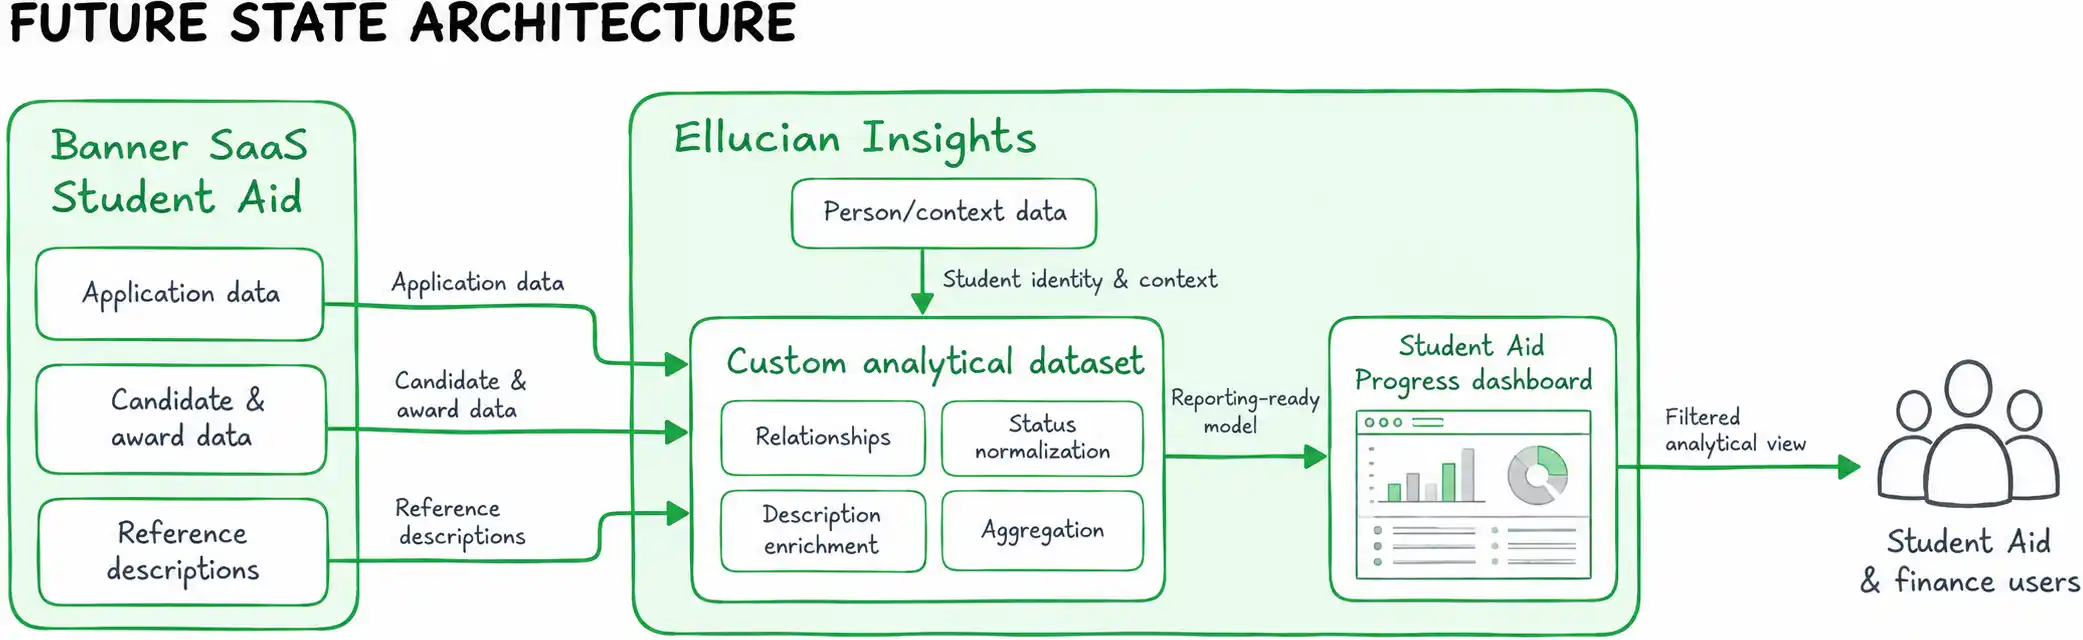
The resulting data flow keeps operational Student Aid records separate from the analytical model used for reporting. The reporting layer can then present fields and measures in terms that match how staff monitor the process.

Turning the data model into an interactive operational dashboard
The analytical model powers a dashboard that combines summary information with detailed operational data.
At the top level, users can see the total number of applications, the monetary total associated with awards, and a breakdown by aid fund. Filters let them narrow the view by Aid Year, Aid Period, Student, Aid Fund, Application Status, and Award Status.

What should a user be able to learn before opening another report or inspecting an individual Banner record?
The detailed view answers that question within the same dashboard. Users can see the student and fund context alongside application and award status, outcome information, award amount, lock state, and award comments.
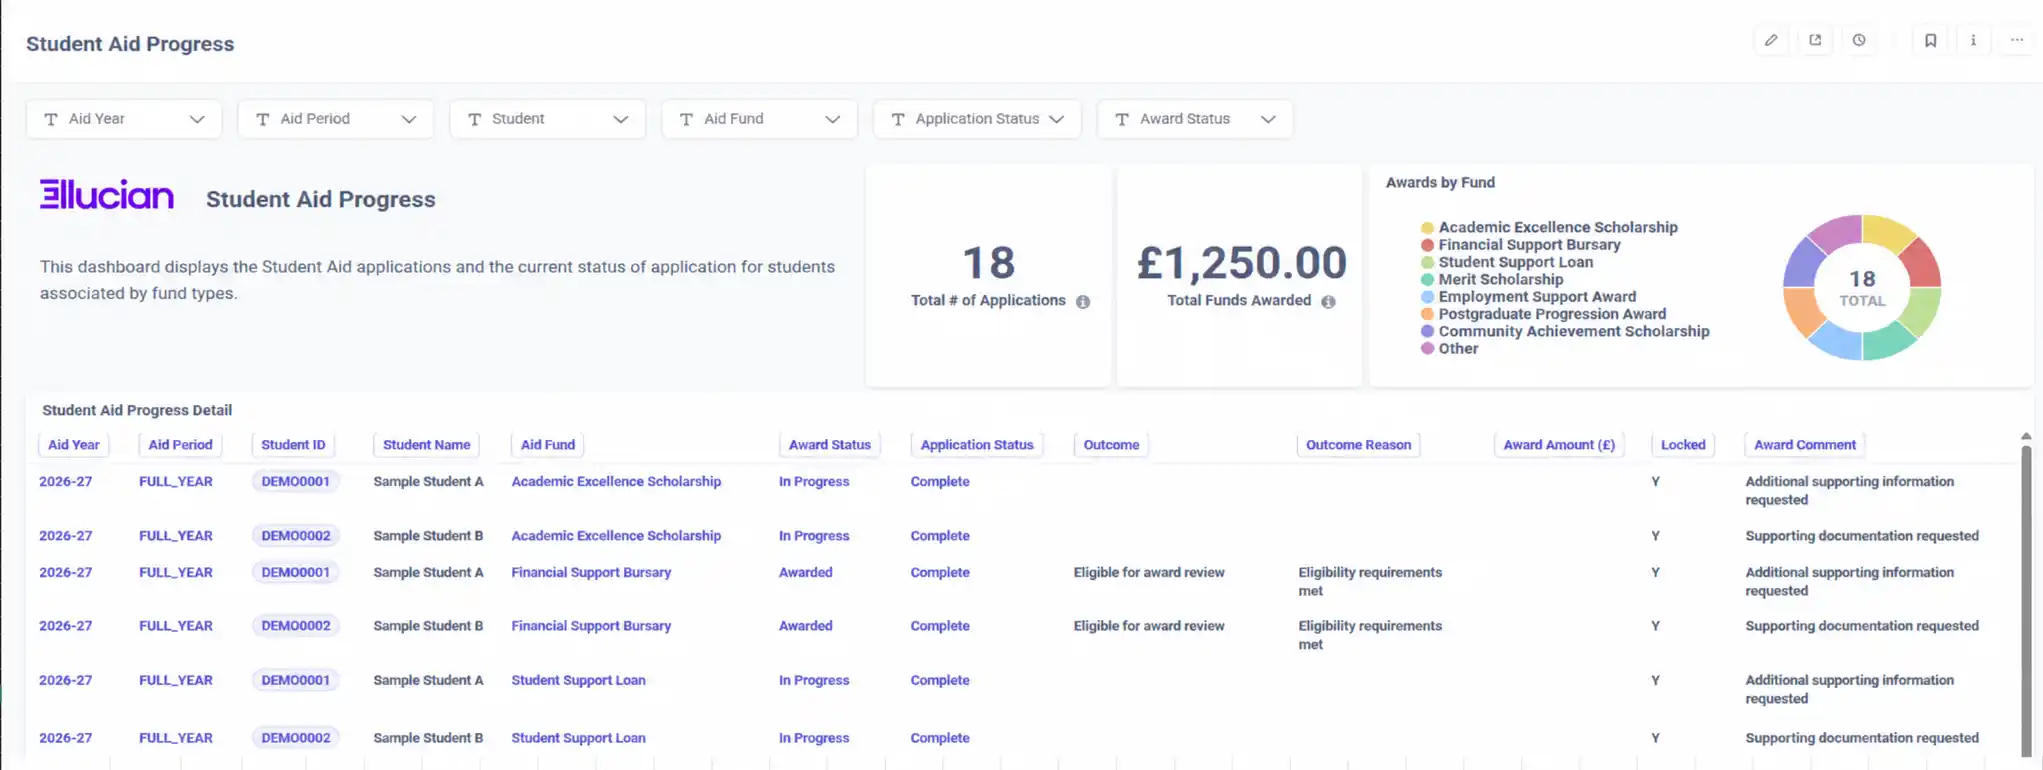
The design gives users an immediate summary view along with enough detail to investigate the applications and awards contributing to it.
How the dashboard supports day-to-day Student Aid oversight
The completed dashboard gives Student Aid and finance users one place to review application and award information.
Users can begin with overall activity, identify how records are distributed across funds, and then narrow the view by year, period, student, fund, or processing state. The custom data model also translates much of the underlying Banner complexity into business-facing fields and statuses, so the dashboard reflects the administrative process instead of mirroring the database structure.
Dashboard access is limited to the relevant Student Aid and finance users through role- or individual-level permissions.

Student Aid staff can move from a summary view to individual application and award details without leaving the dashboard.
Frequently asked questions
Need a clearer operational view of your Banner SaaS data?
If your teams have the Banner SaaS data they need but lack a clear analytical view for managing an important process, ABCloudz can help design the underlying data model and turn it into a practical reporting solution.
Contact ABCloudz to discuss your Ellucian reporting or modernization challenge and the next step.